STATUS: IMPORTANT UPDATE 2/6/13 : THIS PAGE IS BEING REDESIGNED AND REIMPLEMENTED FOR THE 2013 WESTERN WILDFIRE SEASON. SOME FEATURES AND LINKS MAY BE BROKEN IN THE MEANTIME. WE APOLOGIZE FOR THE INCONVENENCE.
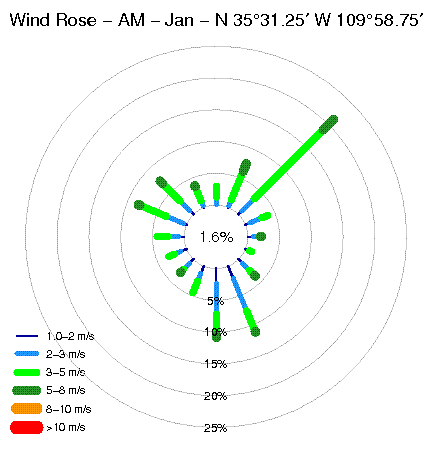
RAWS based day and night windroses for nearest site produced by: CEFA/DRI
Analysis of historic RAWS data for the nearest site to your fire location showing day and night patterns that determine potential night-time drainage of smoke.
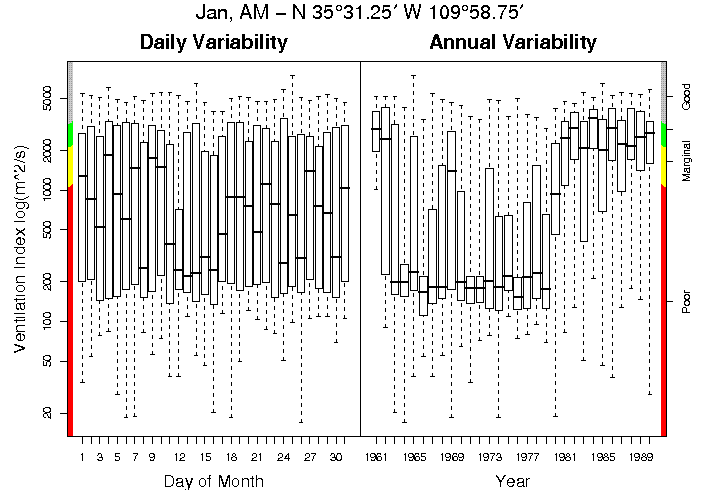
Climatological Venitilation Index Point Statistics
modeled mixing height, winds, and ventiliation index climatology on super-high-resolution grid produced by: Ventilation Climate Information System (VCIS) by USFS AirFire
Analysis of historic model interpolated data showing day and night wind patterns, mixing heights, and ventilation index. Can be used in determining the potential for night-time drainage of smoke.
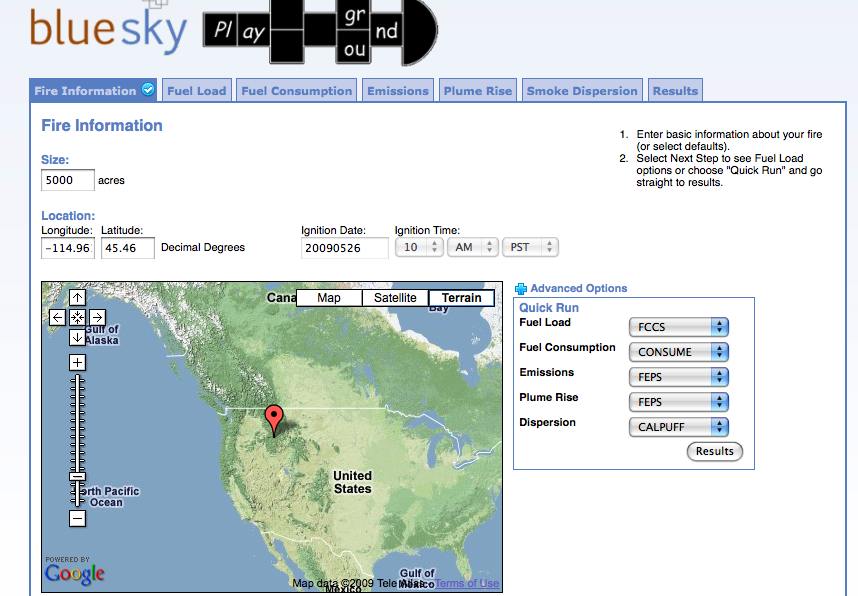
fully configurable while-you-wait modeling that allows comparison between models produced by: BlueSky Playground system by USFS AirFire and STI
Interactive website that allows the user to choose their fuel loadings, fire consumption model, and more. Outputs are viewable at every step and can be changed before continuing. Model runs done while-you-wait, including smoke impacts. Currently single fire only.
Fuel Loadings
Fire Consumption
Fire Emissions
Plume Rise
Smoke Concentrations
National Coverage
Customizable - input your fire information, change any modeled values
Interactive - view results while you wait
Uses a variety of meteorological data including National Weather Service forecasts
Fuels and consumption done on 1-km grid / smoke dispersion on meteorological grids (4-, 12-, and 30-km depending on source)
ATTRIBUTES
INSTANT ACCESS
EASY TO USE
๏
LOCALIZED
■
REGIONAL
text
graphics
↹
INTERACTIVE
SMOKE
CONCENTRATIONS
Playground is still in beta testing. We value your feedback.