Wildland Fire Air Quality Tools
WFDSS Integrated Tools v0.9 (Beta Test)
THIS PAGE IS BEING REDESIGNED AND REIMPLEMENTED FOR THE 2013 WESTERN WILDFIRE SEASON.
SOME FEATURES AND LINKS MAY BE BROKEN IN THE MEANTIME.
WE APOLOGIZE FOR THE INCONVENENCE.
|
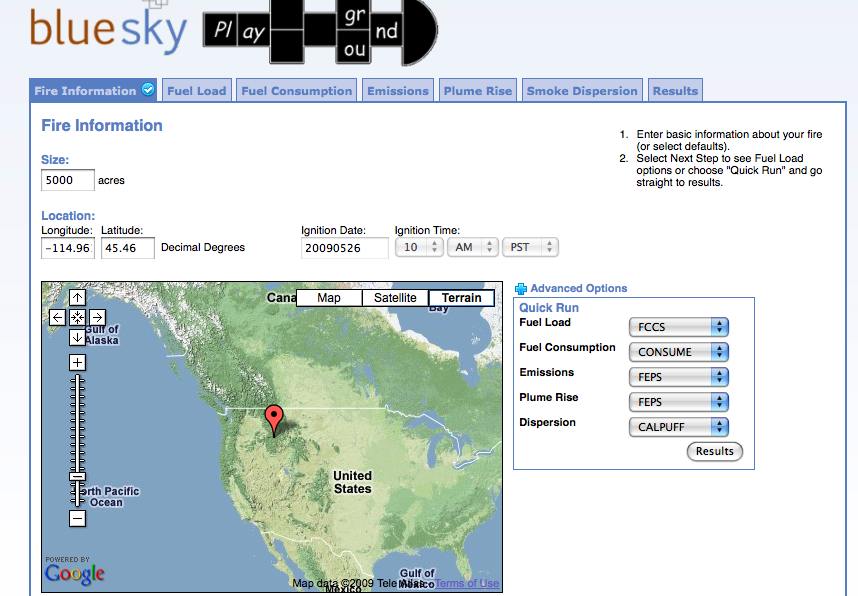
STEP 1
Set your fire location:
location
used for tailored products.
|
STEP 2
 Select Your Tool: Select Your Tool:See below for tool description, attributes, and
other details.
|
|
Filter by: ATTRIBUTE FORECAST PERIOD |
|
|||||||||||||||||||||||||||||||||||||||||||||||||||||||||||||||||||||||||||||||||||||||||||||||